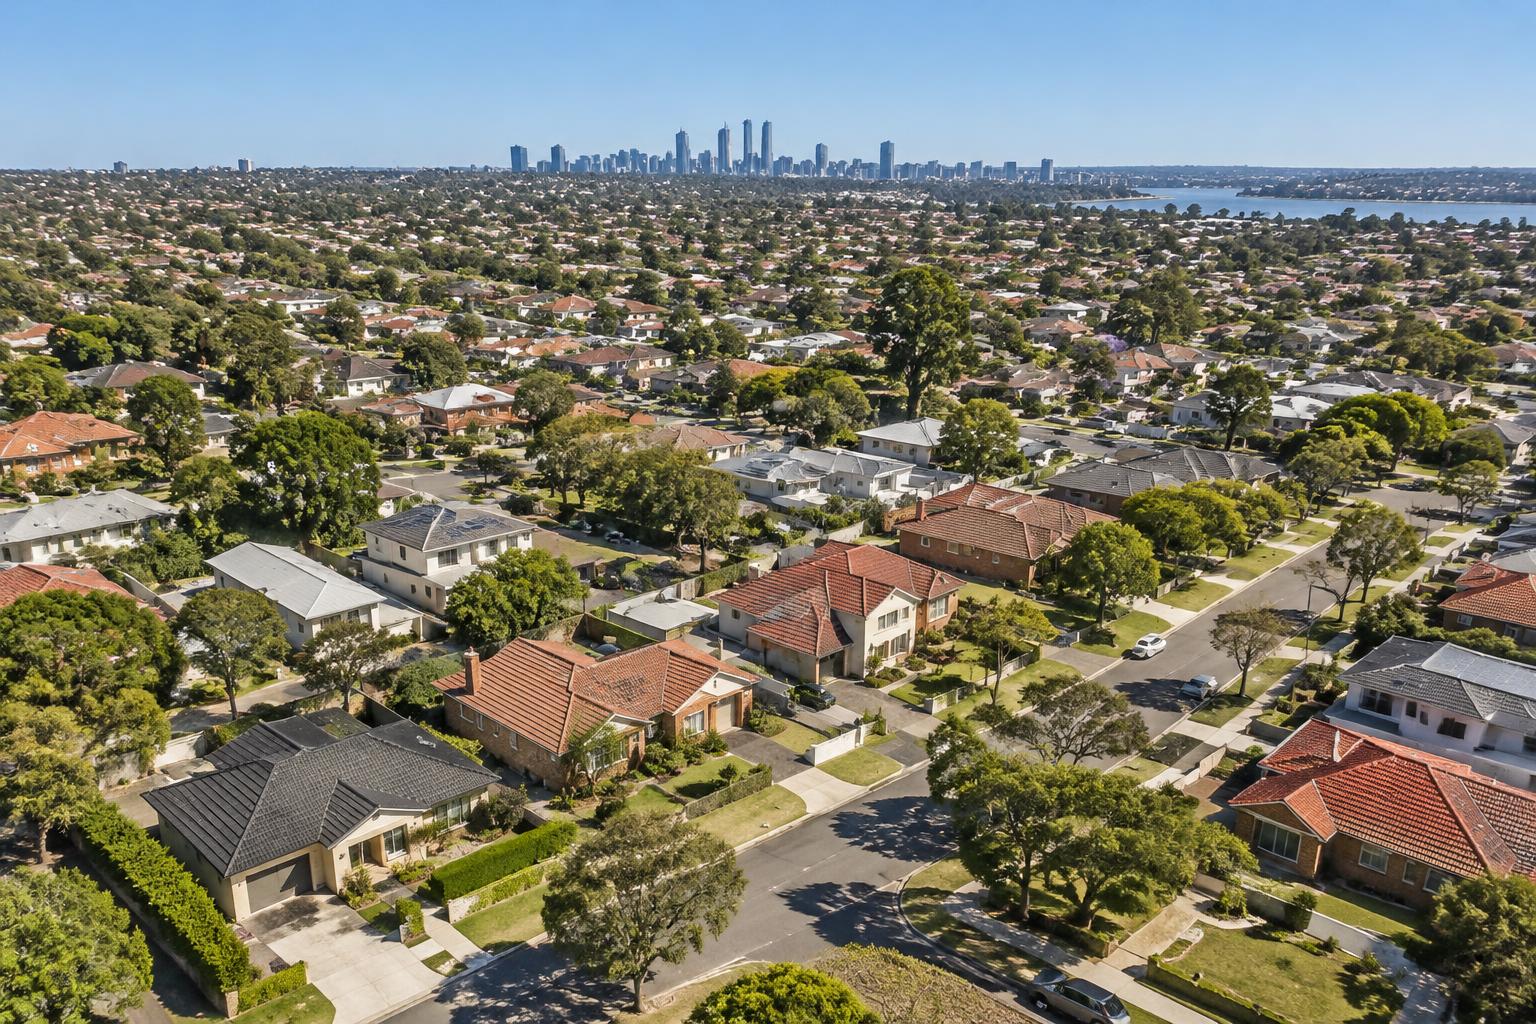
For the first time in 15 years, house prices fell in every single Australian capital city in the same quarter. Domain's September 2026 House Price Report, published on 21–22 October, records a 4.7% national quarterly fall — the steepest on record — and only the second time in its data history that all eight capitals have declined together. Markets that started the year moving at very different speeds "are now moving in the same direction". 1 3
The dollar figures are confronting. Domain reports as much as $89,000 wiped off median house prices in some cities in just 90 days, with the combined capital-city median now at $1,226,566. 2
This is not a repeat of last week's Perth listings story — it's bigger. The downturn has gone national, synchronised, and it's being led from the top of the market down.
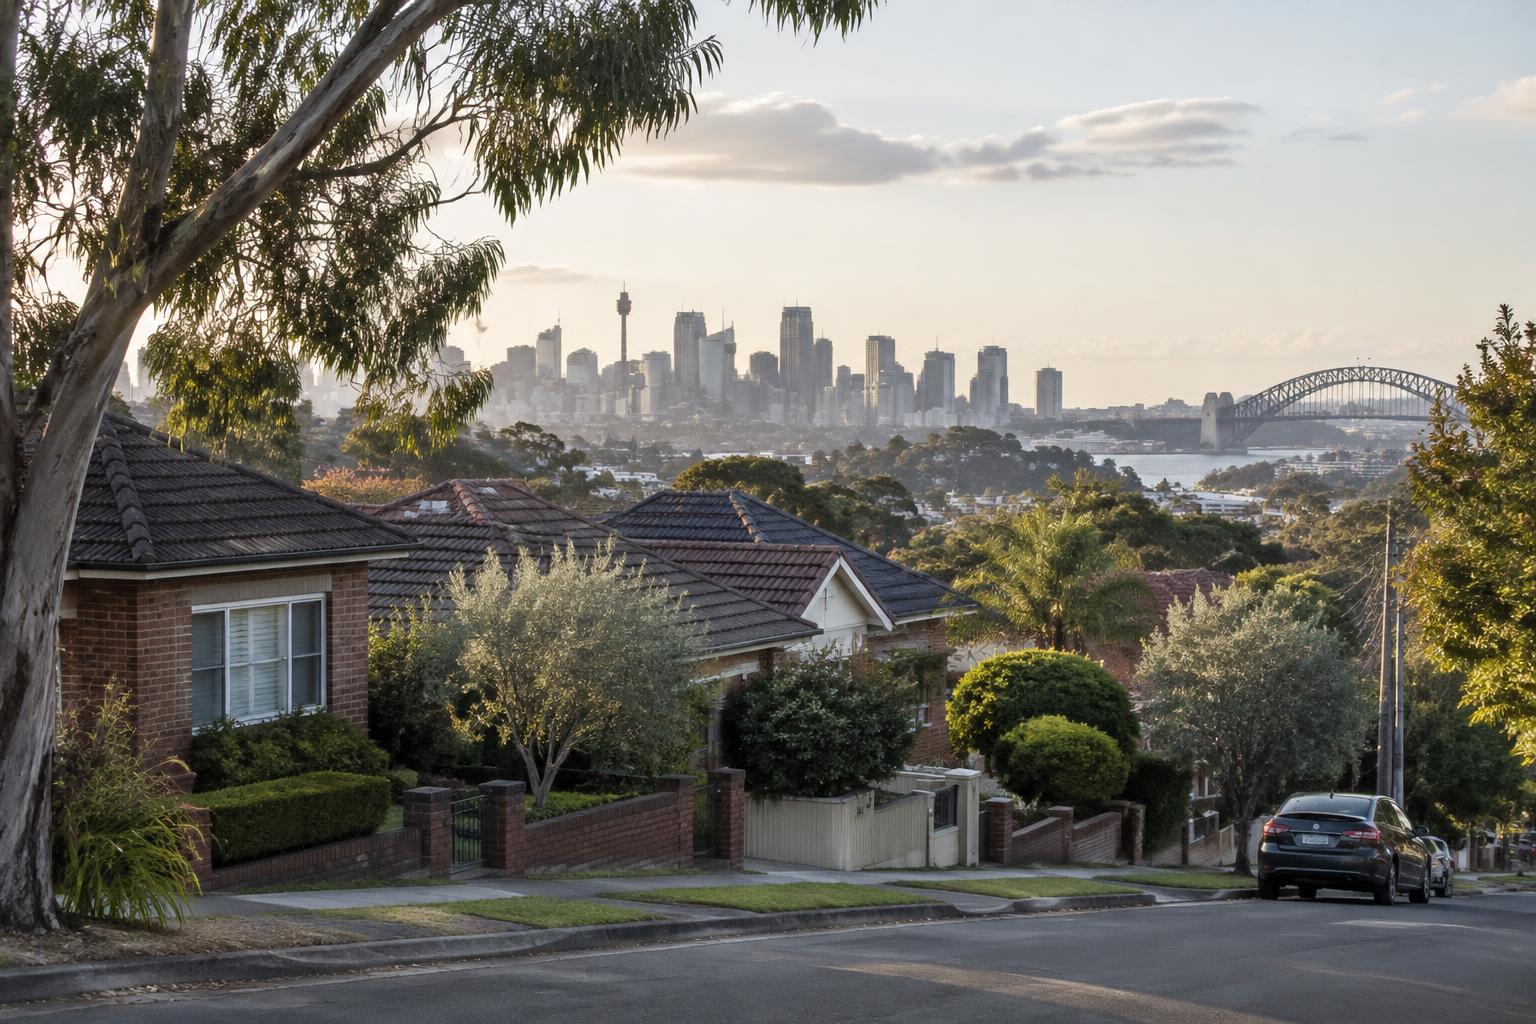
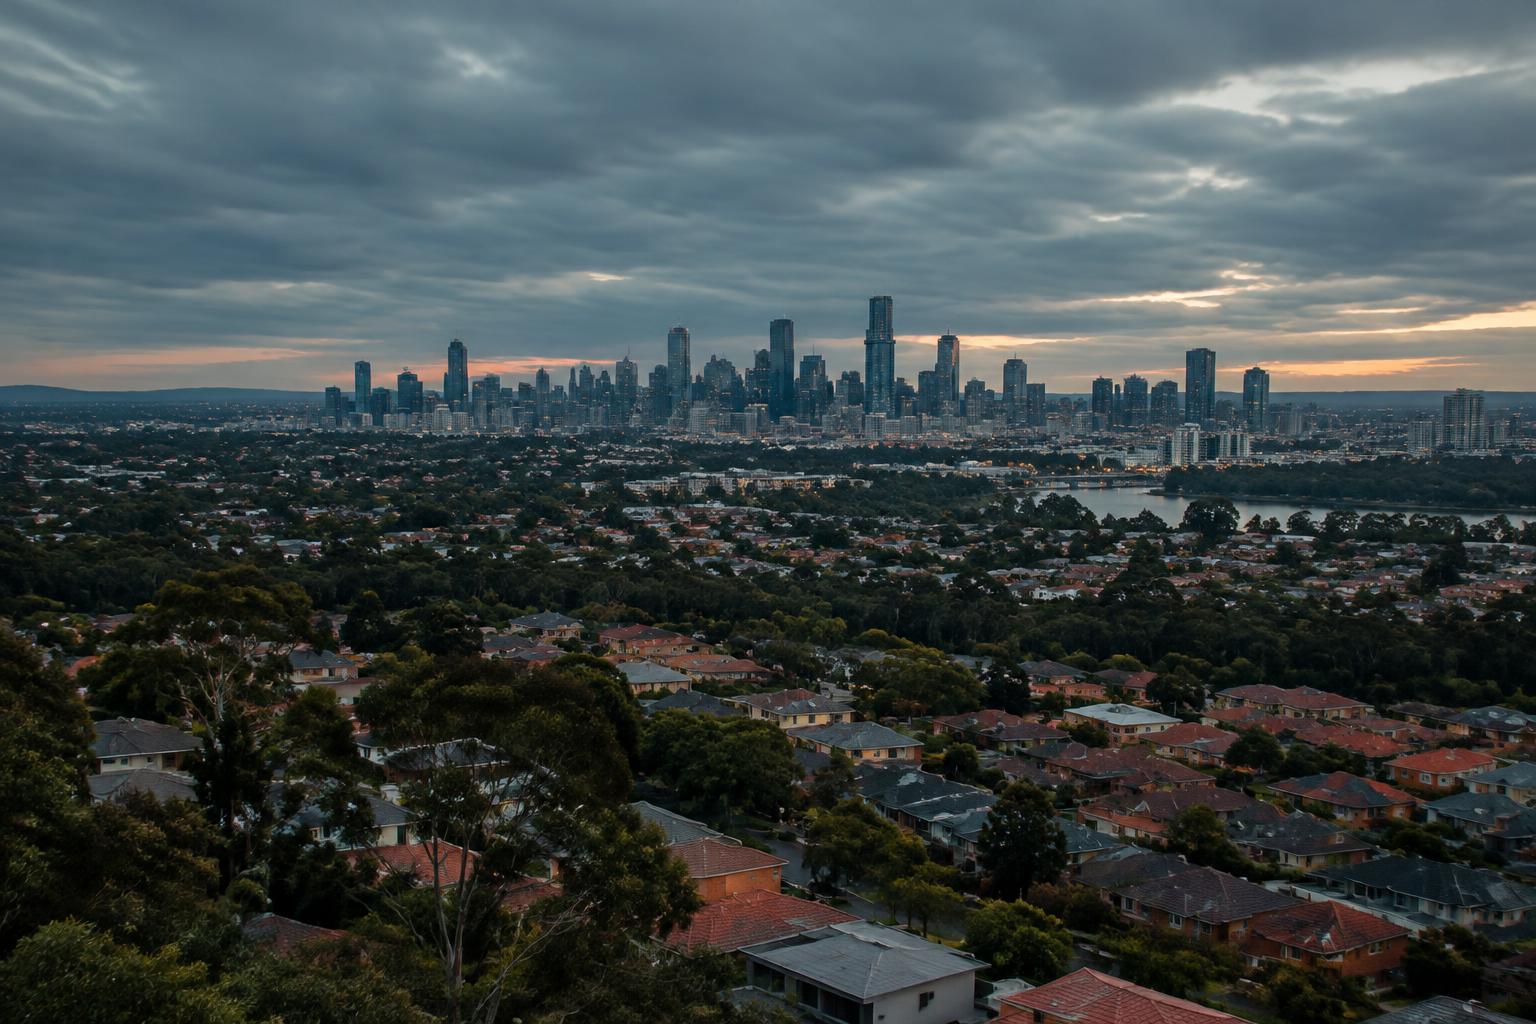
The sources below were published 21–24 October 2026. Domain's report covers the September quarter; the auction figures are from the week ending 24 October. The image is an AI-generated Australian cityscape illustration, not a photograph of any specific market.
The city-by-city scoreboard
Domain's September-quarter results, as reported by ABC News: 3
| Market | September quarter house price change | Context |
|---|---|---|
| National (combined capitals) | −4.7% | Steepest quarterly fall on Domain's record |
| Perth | −7.4% | Sharpest fall of any capital |
| Sydney | −4.7% | Largest quarterly drop in four years |
| Melbourne | −3.3% | Largest quarterly drop in four years |
Source: Domain House Price Report, September 2026 quarter, via ABC News. All eight capitals fell; the table shows the figures published in the coverage we verified. Unit prices fell 3.5% nationally — the second consecutive quarter both houses and units declined. 1 3
The Perth number deserves a pause. This was the market leading the nation less than a year ago — and it now holds both the sharpest quarterly fall and, as we covered last week, a tripling of homes listed for sale. Boom markets don't gently plateau; they reverse.
The top end is falling fastest
The falls are not evenly shared. Cotality's analysis, reported alongside the Domain release, shows Australia's most valuable homes are recording the biggest drops, while lower-value homes have remained relatively stable. In Sydney, the most valuable quartile of homes dropped more than twice as much as the least valuable quartile. Darwin's lowest-value quartile actually grew. 3
Property economist Cameron Kusher's explanation is mechanical, not mysterious: expensive homes saw the largest gains in recent years, and when the market slows there are simply fewer buyers who can finance them. Higher borrowing costs hit the top end hardest because that's where loan sizes are largest. 3
That pattern matches what we found in Melbourne's entry-level market: cheaper homes holding up because they're the only ones buyers can still afford. The median house, as Cotality's Gerard Burg put it, "really appears kind of out of reach of the median income household across much of the country". 3
Melbourne is about to exit the million-dollar club
The symbolic line of the week: Melbourne's median house price sits just $14,000 above $1 million, and Domain reports it's tipped to fall below that threshold by year's end — which would be its lowest level since March 2021. 4
A six-figure Melbourne median would have been unthinkable at the peak. Whether it matters financially is another question — a median is a statistical midpoint, not your home's value — but thresholds like this change buyer psychology, and psychology is what clears or kills auctions.
Last weekend's auctions: buyers have stopped showing up
Quarterly reports tell you where the market has been. Auctions tell you where it is right now — and the weekend of 18–24 October was bleak: 5 6
| Market | Clearance rate (week ending 24 Oct) | A year ago |
|---|---|---|
| National | 43.4% | 67.2% |
| Sydney | 45% | — |
| Melbourne | 56% | 66% |
| Brisbane | 20% | — |
Sources: Domain preliminary auction results, 18–24 October; My Housing Market National Auction Report, 24 October. Preliminary figures are revised as more results are reported.
Read that Brisbane number again: one in five auctions cleared. Nationally, clearance rates have collapsed from two-thirds to well under half in twelve months, and Cotality counts auction volumes at roughly half last year's level — just 1,423 capital-city auctions last week. Sellers are staying away, and the sellers who do list are increasingly passing in. 3 6
Why it's happening — and why the budget isn't the whole story
Three forces are compounding, per the economists quoted in the coverage: 3
- Three consecutive interest rate hikes have slashed borrowing capacity — the mechanism we detailed in our APRA buffer explainer. Burg calls it "a demand-led downturn": buyers haven't vanished, they simply can't borrow what these prices require.
- Confidence has evaporated. Kusher describes would-be buyers doing the maths: "prices are falling, why would I jump in now… if I wait another six or 12 months properties will probably be cheaper." That waiting game is self-fulfilling.
- The May budget's investment tax changes added to the gloom — but both Kusher and Burg stress prices peaked last year and were already falling before the budget. The budget accelerated a downturn; it didn't start one.
Domain's chief economist Nicola Powell summarises the shift: "The balance of power has shifted towards buyers. Homes are taking longer to sell, there is greater scope to negotiate, and sellers are having to be more realistic about price expectations." 3
What to watch next
- Melbourne Cup Day, 3 November: the RBA meets again. Another hike would tighten the borrowing-capacity screw further; a hold won't restore the capacity already lost. 6
- Whether the top-end fall cascades: expensive suburbs falling fastest eventually pulls comparable sales down for everyone.
- Spring listing volumes: if sellers who delayed through winter list into falling clearance rates, the stock overhang we tracked in September's housing falls gets worse.
The takeaway: a synchronised, record-speed national fall led by the most expensive homes is a different beast from a patchy slowdown. If you hold property, your city-wide median is now a lagging indicator — your own equity position, loan rate and cash flow are what you can actually manage.
Keep each property's income, expenses and current loan details in one place so you can see your real position, not the headline's. See how PropAlly organises property records, and run the numbers on our negative gearing calculator before your next decision.
Sources checked 26 October 2026. General information only, not financial, credit or tax advice. Domain, Cotality and auction-data providers use different methodologies and revise preliminary figures; quarterly median changes are not a valuation of any individual property. Seek licensed advice for your circumstances.